Review: Stratmosphere HyperFlow Intake

Thread Starter
Audiworld Junior Member
Joined: Mar 2011
Posts: 24
Likes: 0
Background
The OEM intake in our 2011 Audi S4 is tasked with a number of conflicting job requirements. First, the intake tract was designed to help reduce the natural whine produced from the supercharger. Second, the enclosed air box with a snorkel leading to a small lateral gap in the grille is supposed to help moderate intake temperatures. Third, the air intake is designed to still be free flowing enough to allow the engine to produce its manufacturer stated 333hp. As a build such as ours progresses it is only natural to begin to look for a performance intake with the hope that it is able to move colder air more efficiently. Enter the Stratmosphere HyperFlow intake for the Audi B8 S4 3.0T engine.
What�s in the Box?
The design of the intake is simple. In its purest form it is literally a pipe with a filter separated from the engine bay by a heat shield. In addition to its simplicity, the Stratmosphere HyperFlow intake is extremely well made. The metal fabrication is top notch and the heat shield comes pre-assembled with all rubber edging and hose ties to secure the OEM equipment. Along with the heat shield the kid contained a filter, intake pipe, vacuum tube extension, a secondary air filter, zip ties and a 3 adjustable hose clamps. The supplied instructions were easy to follow and the intake swap can be completed in as little as 15 minutes with a simple flat head screw driver.
Now Let�s Get to the Data
Just an intake, in the purest sense, cannot �make� power. What we can hope for is a design that delivers colder air to the engine in a more efficient manner which both alleviates the drag of the intake stroke and supplies denser air for the power stroke. All else equal, we are simply looking to �release� power that the stock intake system is holding hostage. For this round of testing, we took a slightly different initial approach to our methodology but still kept true to our performance testing mandate. In order to log additional data, we took our GPS performance and VCDS hardware out for a two day workout and when all was said and done we ended up logging over 50,000 data points. Here are our findings.
Intake Air Temperatures (IATs)
We first want to draw your attention to the slope of the linear regression lines. The HyperFlow intake has a steeper slope than the stock air box which shows the intake air temperature changes more than the OEM unit given the same change in vehicle speed. Further, the negative slope highlights that as your vehicle speed increases, the intake air temperature readings decrease. With the HyperFlow intake, our IATs decreased, on average, by 4�C over our entire data set versus the stock intake with the same ambient temperature range (25-27�C). However, the range of our IATs did increase and is especially noticeable when the car is in traffic or travelling slowly. Our data suggests that the HyperFlow intake will produce higher IATs when stopped but once the car moves forward the IATs drop quickly to values lower than the stock unit.
While both the stock unit and the HyperFlow showed a decrease in IATs as speed increased, the R� values are also worth a discussion (Stock = 49.2%, HyperFlow = 67.4%). The correlation between vehicle speed and IATs is much greater with the HyperFlow intake than the stock unit and as a result the IATs drop to lower absolute values much quicker than the stock unit despite the open element design � a 37% faster rate of change. One theory of why this is possible stems from the location of the supplied heat shield which is smartly placed directly between the passenger side exhaust header and the area quarantined for the air filter. The stock air box sits directly next to the exhaust header unit and may retain much more heat than the design would suggest. Our exhaust temperatures reached a maximum of almost 1,000�C and will inevitably have a spillover effect unless properly managed.
Performance Data
Due to our exhaust situation we�ve decided to hold off on road circuit events until we take possession of our new headers. As a result, these performance tests were still conducted in real world situations but on public roads and we chose two specific performance metrics for reasons we will dive into later. First was 30-50mph and the second was 70-90mph timed runs.
In the time vs. speed chart above, the green line (HyperFlow) has a much steeper slope than the black (stock) line. What this means is that we covered more ground in less time yielding a much quicker 30-50mph run. On average, which consisted of 5 stock vs. 5 HyperFlow runs, we averaged almost 0.1 second quicker from 3o to 50mph with the HyperFlow intake installed. However, once we reached higher RPM ranges both values started to converge. Again in the chart above, you can see that both lines start to overlap exactly as we cross 50mph. While this may be a simple coincidence (remote possibility), we cannot help but be suspect of our exhaust restriction. If the exhaust was restrictive enough to stop the engine from making any additional power even with the stock airbox in place, the change of intake would make no difference once the restriction point is realized.
This theory is further solidified in our 70-90mph tests. What is interesting in the graph of the higher speed runs is that the slopes are identical. Our data points confirm that fact and as a result our times with the HyperFlow intake were exactly the same as the stock air box. There was less than 3/10ths of 1% difference between our averages. Based simply on the IAT data above we should expect some measurable difference (either way) unless the engine was hitting a power ceiling with both the HyperFlow and OEM unit that was unrelated to the intake side of the system.
Conclusion
We can be certain that our IATs were colder and our lower RPM pulls were faster with the HyperFlow intake. Additionally, the open element filter unleashes the supercharger�s natural whine, which for those who find the unique sound appealing, is a fun add-on (video soon). However, despite all of the data we gathered we currently cannot issue a formal recommendation due to the possibility of the exhaust restriction playing too large of a role in our testing. We hope to have our headers installed in about two weeks and will re-run our tests and issue a formal recommendation at that time. However, the data we can rely on does look promising. Stay tuned.
-The CircuitTested Crew
Any questions, comments or concerns? Feel free to shoot us an E-Mail.
Additional Pictures:
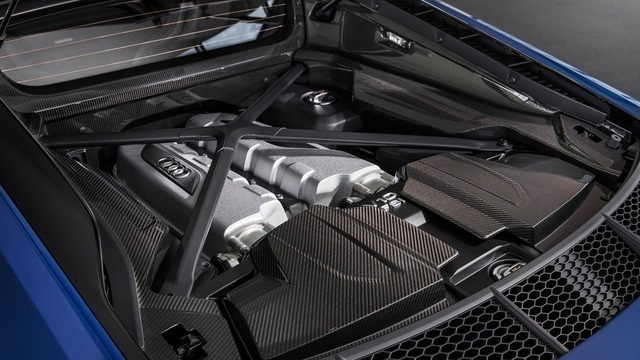
One reason to help explain the lower IATs despite the �open element� design may be the strategic placement of the head shield. The first picture is of the engine bay with the stock airbox removed and the second with just the Stratmosphere heat shield installed.
The OEM intake in our 2011 Audi S4 is tasked with a number of conflicting job requirements. First, the intake tract was designed to help reduce the natural whine produced from the supercharger. Second, the enclosed air box with a snorkel leading to a small lateral gap in the grille is supposed to help moderate intake temperatures. Third, the air intake is designed to still be free flowing enough to allow the engine to produce its manufacturer stated 333hp. As a build such as ours progresses it is only natural to begin to look for a performance intake with the hope that it is able to move colder air more efficiently. Enter the Stratmosphere HyperFlow intake for the Audi B8 S4 3.0T engine.
What�s in the Box?
The design of the intake is simple. In its purest form it is literally a pipe with a filter separated from the engine bay by a heat shield. In addition to its simplicity, the Stratmosphere HyperFlow intake is extremely well made. The metal fabrication is top notch and the heat shield comes pre-assembled with all rubber edging and hose ties to secure the OEM equipment. Along with the heat shield the kid contained a filter, intake pipe, vacuum tube extension, a secondary air filter, zip ties and a 3 adjustable hose clamps. The supplied instructions were easy to follow and the intake swap can be completed in as little as 15 minutes with a simple flat head screw driver.
Now Let�s Get to the Data
Just an intake, in the purest sense, cannot �make� power. What we can hope for is a design that delivers colder air to the engine in a more efficient manner which both alleviates the drag of the intake stroke and supplies denser air for the power stroke. All else equal, we are simply looking to �release� power that the stock intake system is holding hostage. For this round of testing, we took a slightly different initial approach to our methodology but still kept true to our performance testing mandate. In order to log additional data, we took our GPS performance and VCDS hardware out for a two day workout and when all was said and done we ended up logging over 50,000 data points. Here are our findings.
Intake Air Temperatures (IATs)
We first want to draw your attention to the slope of the linear regression lines. The HyperFlow intake has a steeper slope than the stock air box which shows the intake air temperature changes more than the OEM unit given the same change in vehicle speed. Further, the negative slope highlights that as your vehicle speed increases, the intake air temperature readings decrease. With the HyperFlow intake, our IATs decreased, on average, by 4�C over our entire data set versus the stock intake with the same ambient temperature range (25-27�C). However, the range of our IATs did increase and is especially noticeable when the car is in traffic or travelling slowly. Our data suggests that the HyperFlow intake will produce higher IATs when stopped but once the car moves forward the IATs drop quickly to values lower than the stock unit.
While both the stock unit and the HyperFlow showed a decrease in IATs as speed increased, the R� values are also worth a discussion (Stock = 49.2%, HyperFlow = 67.4%). The correlation between vehicle speed and IATs is much greater with the HyperFlow intake than the stock unit and as a result the IATs drop to lower absolute values much quicker than the stock unit despite the open element design � a 37% faster rate of change. One theory of why this is possible stems from the location of the supplied heat shield which is smartly placed directly between the passenger side exhaust header and the area quarantined for the air filter. The stock air box sits directly next to the exhaust header unit and may retain much more heat than the design would suggest. Our exhaust temperatures reached a maximum of almost 1,000�C and will inevitably have a spillover effect unless properly managed.
Performance Data
Due to our exhaust situation we�ve decided to hold off on road circuit events until we take possession of our new headers. As a result, these performance tests were still conducted in real world situations but on public roads and we chose two specific performance metrics for reasons we will dive into later. First was 30-50mph and the second was 70-90mph timed runs.
In the time vs. speed chart above, the green line (HyperFlow) has a much steeper slope than the black (stock) line. What this means is that we covered more ground in less time yielding a much quicker 30-50mph run. On average, which consisted of 5 stock vs. 5 HyperFlow runs, we averaged almost 0.1 second quicker from 3o to 50mph with the HyperFlow intake installed. However, once we reached higher RPM ranges both values started to converge. Again in the chart above, you can see that both lines start to overlap exactly as we cross 50mph. While this may be a simple coincidence (remote possibility), we cannot help but be suspect of our exhaust restriction. If the exhaust was restrictive enough to stop the engine from making any additional power even with the stock airbox in place, the change of intake would make no difference once the restriction point is realized.
This theory is further solidified in our 70-90mph tests. What is interesting in the graph of the higher speed runs is that the slopes are identical. Our data points confirm that fact and as a result our times with the HyperFlow intake were exactly the same as the stock air box. There was less than 3/10ths of 1% difference between our averages. Based simply on the IAT data above we should expect some measurable difference (either way) unless the engine was hitting a power ceiling with both the HyperFlow and OEM unit that was unrelated to the intake side of the system.
Conclusion
We can be certain that our IATs were colder and our lower RPM pulls were faster with the HyperFlow intake. Additionally, the open element filter unleashes the supercharger�s natural whine, which for those who find the unique sound appealing, is a fun add-on (video soon). However, despite all of the data we gathered we currently cannot issue a formal recommendation due to the possibility of the exhaust restriction playing too large of a role in our testing. We hope to have our headers installed in about two weeks and will re-run our tests and issue a formal recommendation at that time. However, the data we can rely on does look promising. Stay tuned.
-The CircuitTested Crew
Any questions, comments or concerns? Feel free to shoot us an E-Mail.
Additional Pictures:
One reason to help explain the lower IATs despite the �open element� design may be the strategic placement of the head shield. The first picture is of the engine bay with the stock airbox removed and the second with just the Stratmosphere heat shield installed.
Thread Starter
Audiworld Junior Member
Joined: Mar 2011
Posts: 24
Likes: 0
Background
The OEM intake in our 2011 Audi S4 is tasked with a number of conflicting job requirements. First, the intake tract was designed to help reduce the natural whine produced from the supercharger. Second, the enclosed air box with a snorkel leading to a small lateral gap in the grille is supposed to help moderate intake temperatures. Third, the air intake is designed to still be free flowing enough to allow the engine to produce its manufacturer stated 333hp. As a build such as ours progresses it is only natural to begin to look for a performance intake with the hope that it is able to move colder air more efficiently. Enter the Stratmosphere HyperFlow intake for the Audi B8 S4 3.0T engine.
What�s in the Box?

The design of the intake is simple. In its purest form it is literally a pipe with a filter separated from the engine bay by a heat shield. In addition to its simplicity, the Stratmosphere HyperFlow intake is extremely well made. The metal fabrication is top notch and the heat shield comes pre-assembled with all rubber edging and hose ties to secure the OEM equipment. Along with the heat shield the kid contained a filter, intake pipe, vacuum tube extension, a secondary air filter, zip ties and a 3 adjustable hose clamps. The supplied instructions were easy to follow and the intake swap can be completed in as little as 15 minutes with a simple flat head screw driver.
Now Let�s Get to the Data
Just an intake, in the purest sense, cannot �make� power. What we can hope for is a design that delivers colder air to the engine in a more efficient manner which both alleviates the drag of the intake stroke and supplies denser air for the power stroke. All else equal, we are simply looking to �release� power that the stock intake system is holding hostage. For this round of testing, we took a slightly different initial approach to our methodology but still kept true to our performance testing mandate. In order to log additional data, we took our GPS performance and VCDS hardware out for a two day workout and when all was said and done we ended up logging over 50,000 data points. Here are our findings.
Intake Air Temperatures (IATs)

We first want to draw your attention to the slope of the linear regression lines. The HyperFlow intake has a steeper slope than the stock air box which shows the intake air temperature changes more than the OEM unit given the same change in vehicle speed. Further, the negative slope highlights that as your vehicle speed increases, the intake air temperature readings decrease. With the HyperFlow intake, our IATs decreased, on average, by 4�C over our entire data set versus the stock intake with the same ambient temperature range (25-27�C). However, the range of our IATs did increase and is especially noticeable when the car is in traffic or travelling slowly. Our data suggests that the HyperFlow intake will produce higher IATs when stopped but once the car moves forward the IATs drop quickly to values lower than the stock unit.
While both the stock unit and the HyperFlow showed a decrease in IATs as speed increased, the R� values are also worth a discussion (Stock = 49.2%, HyperFlow = 67.4%). The correlation between vehicle speed and IATs is much greater with the HyperFlow intake than the stock unit and as a result the IATs drop to lower absolute values much quicker than the stock unit despite the open element design � a 37% faster rate of change. One theory of why this is possible stems from the location of the supplied heat shield which is smartly placed directly between the passenger side exhaust header and the area quarantined for the air filter. The stock air box sits directly next to the exhaust header unit and may retain much more heat than the design would suggest. Our exhaust temperatures reached a maximum of almost 1,000�C and will inevitably have a spillover effect unless properly managed.
Performance Data
Due to our exhaust situation we�ve decided to hold off on road circuit events until we take possession of our new headers. As a result, these performance tests were still conducted in real world situations but on public roads and we chose two specific performance metrics for reasons we will dive into later. First was 30-50mph and the second was 70-90mph timed runs.

In the time vs. speed chart above, the green line (HyperFlow) has a much steeper slope than the black (stock) line. What this means is that we covered more ground in less time yielding a much quicker 30-50mph run. On average, which consisted of 5 stock vs. 5 HyperFlow runs, we averaged almost 0.1 second quicker from 3o to 50mph with the HyperFlow intake installed. However, once we reached higher RPM ranges both values started to converge. Again in the chart above, you can see that both lines start to overlap exactly as we cross 50mph. While this may be a simple coincidence (remote possibility), we cannot help but be suspect of our exhaust restriction. If the exhaust was restrictive enough to stop the engine from making any additional power even with the stock airbox in place, the change of intake would make no difference once the restriction point is realized.

This theory is further solidified in our 70-90mph tests. What is interesting in the graph of the higher speed runs is that the slopes are identical. Our data points confirm that fact and as a result our times with the HyperFlow intake were exactly the same as the stock air box. There was less than 3/10ths of 1% difference between our averages. Based simply on the IAT data above we should expect some measurable difference (either way) unless the engine was hitting a power ceiling with both the HyperFlow and OEM unit that was unrelated to the intake side of the system.
Conclusion
We can be certain that our IATs were colder and our lower RPM pulls were faster with the HyperFlow intake. Additionally, the open element filter unleashes the supercharger�s natural whine, which for those who find the unique sound appealing, is a fun add-on (video soon). However, despite all of the data we gathered we currently cannot issue a formal recommendation due to the possibility of the exhaust restriction playing too large of a role in our testing. We hope to have our headers installed in about two weeks and will re-run our tests and issue a formal recommendation at that time. However, the data we can rely on does look promising. Stay tuned.
-The CircuitTested.com Crew
Any questions, comments or concerns? Feel free to shoot us an E-Mail.
Additional Pictures:
One reason to help explain the lower IATs despite the �open element� design may be the strategic placement of the head shield. The first picture is of the engine bay with the stock airbox removed and the second with just the Stratmosphere heat shield installed.


The OEM intake in our 2011 Audi S4 is tasked with a number of conflicting job requirements. First, the intake tract was designed to help reduce the natural whine produced from the supercharger. Second, the enclosed air box with a snorkel leading to a small lateral gap in the grille is supposed to help moderate intake temperatures. Third, the air intake is designed to still be free flowing enough to allow the engine to produce its manufacturer stated 333hp. As a build such as ours progresses it is only natural to begin to look for a performance intake with the hope that it is able to move colder air more efficiently. Enter the Stratmosphere HyperFlow intake for the Audi B8 S4 3.0T engine.
What�s in the Box?
The design of the intake is simple. In its purest form it is literally a pipe with a filter separated from the engine bay by a heat shield. In addition to its simplicity, the Stratmosphere HyperFlow intake is extremely well made. The metal fabrication is top notch and the heat shield comes pre-assembled with all rubber edging and hose ties to secure the OEM equipment. Along with the heat shield the kid contained a filter, intake pipe, vacuum tube extension, a secondary air filter, zip ties and a 3 adjustable hose clamps. The supplied instructions were easy to follow and the intake swap can be completed in as little as 15 minutes with a simple flat head screw driver.
Now Let�s Get to the Data
Just an intake, in the purest sense, cannot �make� power. What we can hope for is a design that delivers colder air to the engine in a more efficient manner which both alleviates the drag of the intake stroke and supplies denser air for the power stroke. All else equal, we are simply looking to �release� power that the stock intake system is holding hostage. For this round of testing, we took a slightly different initial approach to our methodology but still kept true to our performance testing mandate. In order to log additional data, we took our GPS performance and VCDS hardware out for a two day workout and when all was said and done we ended up logging over 50,000 data points. Here are our findings.
Intake Air Temperatures (IATs)
We first want to draw your attention to the slope of the linear regression lines. The HyperFlow intake has a steeper slope than the stock air box which shows the intake air temperature changes more than the OEM unit given the same change in vehicle speed. Further, the negative slope highlights that as your vehicle speed increases, the intake air temperature readings decrease. With the HyperFlow intake, our IATs decreased, on average, by 4�C over our entire data set versus the stock intake with the same ambient temperature range (25-27�C). However, the range of our IATs did increase and is especially noticeable when the car is in traffic or travelling slowly. Our data suggests that the HyperFlow intake will produce higher IATs when stopped but once the car moves forward the IATs drop quickly to values lower than the stock unit.
While both the stock unit and the HyperFlow showed a decrease in IATs as speed increased, the R� values are also worth a discussion (Stock = 49.2%, HyperFlow = 67.4%). The correlation between vehicle speed and IATs is much greater with the HyperFlow intake than the stock unit and as a result the IATs drop to lower absolute values much quicker than the stock unit despite the open element design � a 37% faster rate of change. One theory of why this is possible stems from the location of the supplied heat shield which is smartly placed directly between the passenger side exhaust header and the area quarantined for the air filter. The stock air box sits directly next to the exhaust header unit and may retain much more heat than the design would suggest. Our exhaust temperatures reached a maximum of almost 1,000�C and will inevitably have a spillover effect unless properly managed.
Performance Data
Due to our exhaust situation we�ve decided to hold off on road circuit events until we take possession of our new headers. As a result, these performance tests were still conducted in real world situations but on public roads and we chose two specific performance metrics for reasons we will dive into later. First was 30-50mph and the second was 70-90mph timed runs.
In the time vs. speed chart above, the green line (HyperFlow) has a much steeper slope than the black (stock) line. What this means is that we covered more ground in less time yielding a much quicker 30-50mph run. On average, which consisted of 5 stock vs. 5 HyperFlow runs, we averaged almost 0.1 second quicker from 3o to 50mph with the HyperFlow intake installed. However, once we reached higher RPM ranges both values started to converge. Again in the chart above, you can see that both lines start to overlap exactly as we cross 50mph. While this may be a simple coincidence (remote possibility), we cannot help but be suspect of our exhaust restriction. If the exhaust was restrictive enough to stop the engine from making any additional power even with the stock airbox in place, the change of intake would make no difference once the restriction point is realized.
This theory is further solidified in our 70-90mph tests. What is interesting in the graph of the higher speed runs is that the slopes are identical. Our data points confirm that fact and as a result our times with the HyperFlow intake were exactly the same as the stock air box. There was less than 3/10ths of 1% difference between our averages. Based simply on the IAT data above we should expect some measurable difference (either way) unless the engine was hitting a power ceiling with both the HyperFlow and OEM unit that was unrelated to the intake side of the system.
Conclusion
We can be certain that our IATs were colder and our lower RPM pulls were faster with the HyperFlow intake. Additionally, the open element filter unleashes the supercharger�s natural whine, which for those who find the unique sound appealing, is a fun add-on (video soon). However, despite all of the data we gathered we currently cannot issue a formal recommendation due to the possibility of the exhaust restriction playing too large of a role in our testing. We hope to have our headers installed in about two weeks and will re-run our tests and issue a formal recommendation at that time. However, the data we can rely on does look promising. Stay tuned.
-The CircuitTested.com Crew
Any questions, comments or concerns? Feel free to shoot us an E-Mail.
Additional Pictures:
One reason to help explain the lower IATs despite the �open element� design may be the strategic placement of the head shield. The first picture is of the engine bay with the stock airbox removed and the second with just the Stratmosphere heat shield installed.

AudiWorld Senior Member
Joined: Apr 2011
Posts: 605
Likes: 1
Wow. All of your graphs exhibit such smooth linear delivery with the stock air box. Things look a little sloppier with the strat, albeit faster most of the time. I'm not sure what would be more preferred.
Your review is pretty interesting and informative. Would you possibly be doing a review of the APR Carbonio as well?
Your review is pretty interesting and informative. Would you possibly be doing a review of the APR Carbonio as well?
Last edited by FatalBert; Jul 6, 2011 at 06:21 AM.

Banned
Joined: Mar 2009
Posts: 1,745
Likes: 0
Wow. All of your graphs exhibit such smooth linear delivery with the stock air box. Things look a little sloppier with the strat, albeit faster most of the time. I'm not sure what would be more preferred.
Your review is pretty interesting and informative. Would you possibly be doing a review of the APR Carbonio as well?
Your review is pretty interesting and informative. Would you possibly be doing a review of the APR Carbonio as well?
1. why is there hardly any stock data above 45 mph? There are like 8 STRAT points plotted for every 1 for the stock box.
2. how many pulls is that charted (the IAT chart)...1 each? 2 each? 10 for strat and 2 for stock? Please don't quote linear regression. A part that helps on pull one, but kills you on pulls 3 4 and 5 isn't great. That's the one thing I'd be most concerned about with an open intake...heatsoak and performance after repeated pulls, not one or two. You should certianly care about this if you test on circuits.
3. why is the strat data almost off the charts hot on some of the data points, but the conclusions are that IAT temps are certainly much cooler with the strat part.
4. when were the various pulls done? Same day, same conditions? Same wind direction? If so, what part was tested first? Was the exact same stretch of road used for all of the speed pulls?
5. The 4 different pulls speed chart looks a little odd. Basically three of the pulls look the same, but there's one bad outlier for 'stock'. Why go through all of this exercise only to do 2 pulls for each part? Wouldn't doing ten pulls make more sense, especially considering heatsoak kills most of these open intakes? Personally I'd love to see how my car holds up after repeated pulls or after long driving stints, rather than 2 tiny pulls and done. Why not also do a pull in 3rd gear from 30-90 mph? Much greater chance of seeing any difference vs. less than 2 second 30-50 pull. I'm not sure the relevance of that chosen speed range. All it does is introduce the chance for big variations in data.
6. did you chart the MAF g/sec at any point?
7. on that black and green acceleration chart it looks pretty much dead equal as far as time goes. For some reason, the two pulls are shown starting at different times. why not just chart the 30-50 for each against 0 time? Would sure help.
All in all, it's pretty cool that you are testing this stuff. Would be nice to focus a bit more on getting killer data with excellent controlled conditions. Presenting stuff with charts and nice language is convincing on forums. Better hope you're convincing guys from a proper conclusion.
p.s. your blog says you bought some short tube headers. hopefully the B8 guys are chipping in and paying for these mods...
Last edited by sakimano; Jul 6, 2011 at 12:49 PM.
Thread Starter
Audiworld Junior Member
Joined: Mar 2011
Posts: 24
Likes: 0
2. how many pulls is that charted (the IAT chart)...1 each? 2 each? 10 for strat and 2 for stock? Please don't quote linear regression. A part that helps on pull one, but kills you on pulls 3 4 and 5 isn't great. That's the one thing I'd be most concerned about with an open intake...heatsoak and performance after repeated pulls, not one or two. You should certianly care about this if you test on circuits.
Linear regression does not help on "one pull." It is a calculation based on all available data points in our series.
5. The 4 different pulls speed chart looks a little odd. Basically three of the pulls look the same, but there's one bad outlier for 'stock'. Why go through all of this exercise only to do 2 pulls for each part? Wouldn't doing ten pulls make more sense, especially considering heatsoak kills most of these open intakes? Personally I'd love to see how my car holds up after repeated pulls or after long driving stints, rather than 2 tiny pulls and done. Why not also do a pull in 3rd gear from 30-90 mph? Much greater chance of seeing any difference vs. less than 2 second 30-50 pull. I'm not sure the relevance of that chosen speed range. All it does is introduce the chance for big variations in data.
We logged them. We could not find a statistically meaningful difference either way between the stock airbox and the Stratmosphere unit.
Sure did. Should be finished today or tomorrow and HOPEFULLY installed next week. Are you offering to help pay for them?
Banned
Joined: Mar 2009
Posts: 1,745
Likes: 0
I'm not implying anything...I'm straight out saying that the data you came up with and the methodology used to acquire it seems a bit spotty. Driving around with one part and then driving around with the other part is not very scientific or controlled. The data bears this out.
The speed runs were also not done on the exact same stretch of road. The variability in a speed run (especially a tiny little 30-50 pull) is going to be pretty big based on a number of things. Did the car hit a bump in the road, causing the engine to pull back timing (yes that happens) on one? Was one uphill while the others were marginally downhill? We could see a significant difference on a pull with the smallest grade introduced. I've seen this on logs on my own car, and we see this on NHRA certified dragstrips (which have a very slight incline) vs non-certified dragstrips (which often don't). The tiny acceleration range is also odd...30-50mph. Not sure what the significance of that is, or why we're ignoring 80% of the RPM range in an acceleration pull. Maybe the strat part is great in that range and terrible on the start and the top end? Or vice versa? Wouldn't people want to know that?
I'm saying the data, if it's to be trusted and is going to influence people to say 'I'm buying this thing right now because of this test!' like the one guy on audizine really ought to be tack sharp. With the power of appearing official (despite being a private owner of a car who is doing a private blog in his spare-time) you're going to exert great influence over folks. What's the line from Spider Man? With great power comes great responsibility.I think some people think you're a massive company that does nothing but test parts, especially when you keep saying 'we' 81 times even though your scientific method has described you logging your car while driving it around. It seems more of a hobby for one or two enthusiasts, and that's awesome. Just make sure your audience knows that.
Are you offering to help pay for them?

Thread
Thread Starter
Forum
Replies
Last Post
chrisx706
A4 (B5 Platform) Discussion
0
Nov 29, 2004 02:46 PM
MalibuTony
A4 (B6 Platform) Discussion
0
May 3, 2004 08:52 PM
ChrisTTiaan
TT (Mk1) Discussion
10
May 22, 2002 06:13 AM